
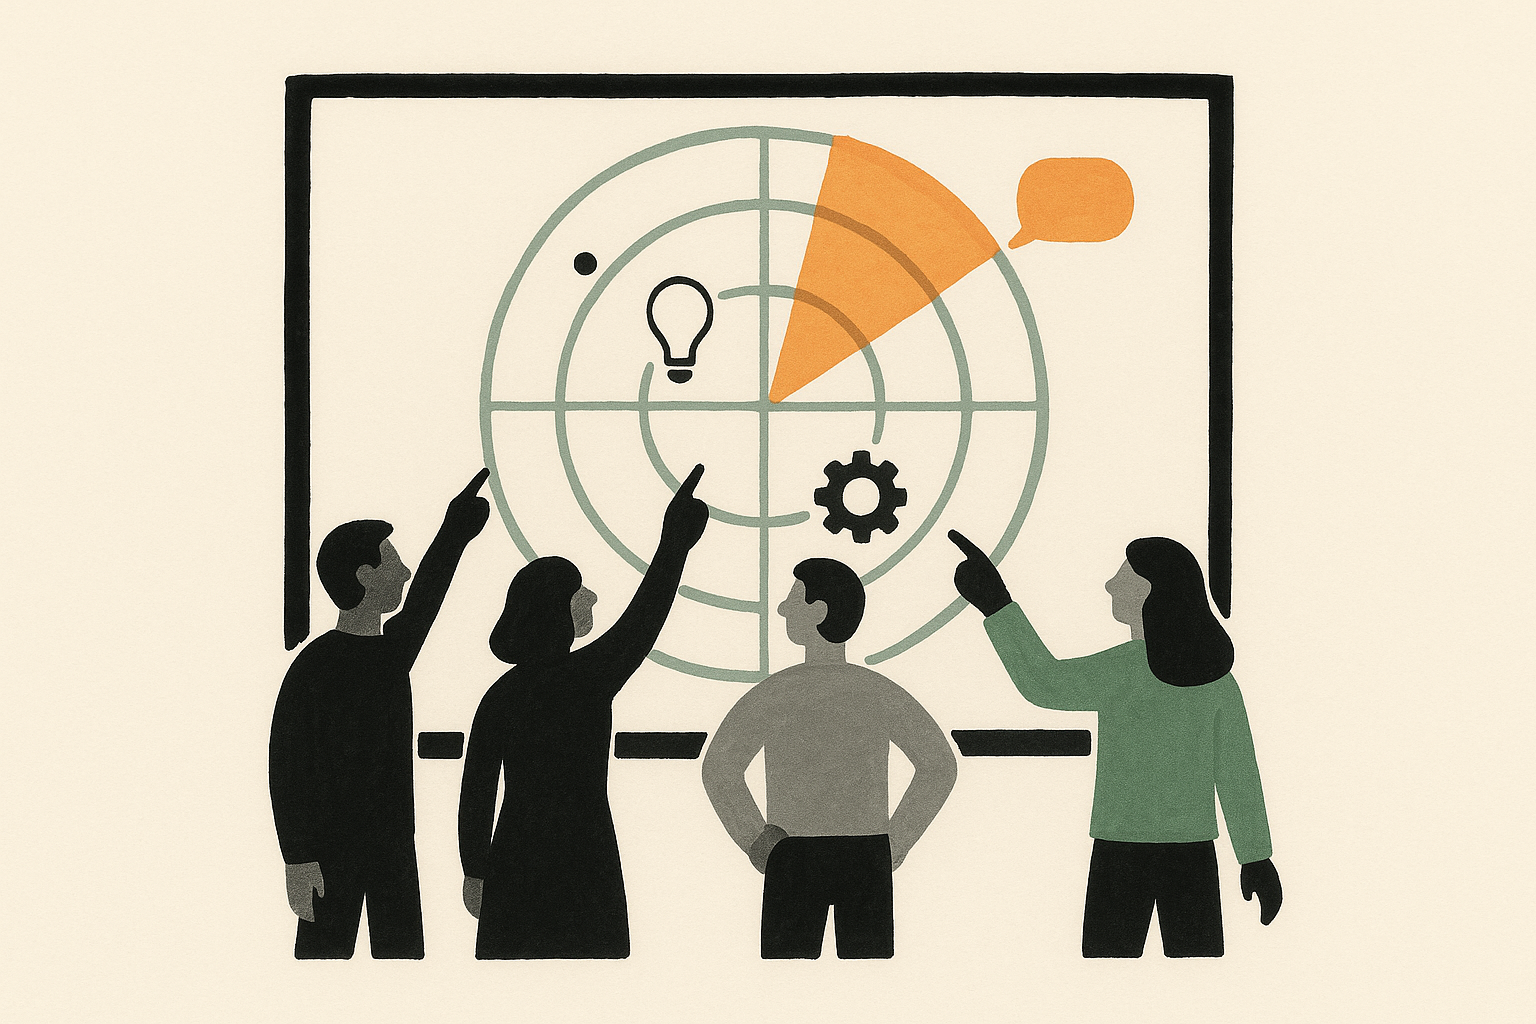
Trend radars are among the most powerful tools in foresight. They're easy to digest, they make foresight work tangible, and management loves them.
Before starting to compile your trend radar, however, it's good to acknowledge that a trend radar is much more than some bubbles on a circle.
But first, some essentials for those of you not yet familiar with the concept of a trend radar.
What is a trend radar?
A trend radar is a popular summary view in foresight. Trend radars are used to summarize trends and technologies in a given scope. They are usually drawn as circles or semicircles and divided into 2 or more sectors for different domains or topics.
Typically, trend radars have several time horizons for evaluating trend maturity or impact time. These horizons can be labeled with a number of years (for example 1-5 years, 5--10 years. and 10+ years) or action suggestions (act, prepare, monitor). Trends with more imminent or likely impacts are placed nearer to the center, and trends with less imminent or likely impacts further.
Additional axes may be used, too. Using different sizes, colors, indicators, or other formats may sometimes be valuable, but we recommend steering away from unnecessary complexity.
The best trend radars are accompanied with in-depth content, for example written trend descriptions. This is because the radar itself is a summary view and can only fit a small amount of information, like the name of the trend.
Different types of trend radars
Trend radars often describe changes taking place for a specific company or industry, and they are usually compiled for a specific purpose, like strategy or innovation.
Technology radars can be used to summarize emerging technologies, and risk radars to map potential hazards in the future.
Different purposes call for different types of radars. The options for naming your sectors and structuring your data on the radar are nearly endless.
At FIBRES, we divide radars into three groups based on how they are structured: domain radars, topic radars, and impact radars.
Domain radars
Domain radars categorize trends based on where the trends themselves originate from. A useful question is to ask: "Where does this trend come from?"
The best-known example of a domain radar is the PESTEL radar. On a PESTEL radar, trends are categorized into political, economical, social, technological, environmental, and legal trends.
For example, if you had identified a trend towards zero-carbon emissions several years ago, you would have likely placed it in the ecological domain.
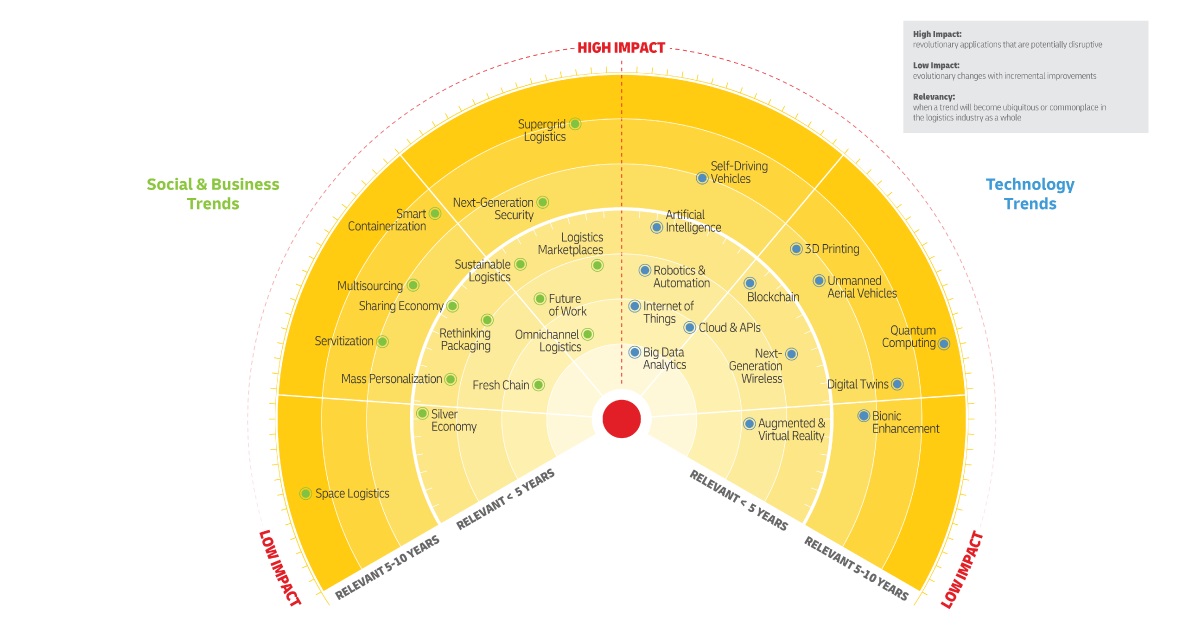
A good example of a domain radar is the DHL Logistics radar. It uses two domains for Social & Business Trends and Technology Trends (link):
Topic radars
Topic radars group trends by topic, such as artificial intelligence, robotics, or climate change. Topic radars are the most common structuring option for technology radars.
The difference between domain radars and topic radars is not always crystal clear. As a rule of thumb, topics are usually more concrete and narrowed-down than domains. A useful question to ask is: "What is this trend by nature?"
Topic radars are useful if you already know which topics are of interest to you. They are also handy for mapping the development of a given topic over time. If you had a sector for artificial intelligence, for example, you could place 5-10 different AI-related trends for your business in that sector.
Here is an example of a tech radar from Norton that has sectors for Tools, Languages and Frameworks, Platforms, and Techniques (link).
In a similar fashion, Zalando's tech radar has been divided into Data Management, Languages, Infrastructure, and Frameworks (link).
Impact radars
Impact radars categorize trends based on how they affect your business.
Whereas both domain and topic radars classify trends based on attributes of the trends themselves, impact radars look at the situation from the perspective of your business.
When compiling an impact radar, a useful question to ask is "Which part of my business does this trend primarily impact?". An impact radar could have, for example, sectors for HR, Finance, and Manufacturing.
The benefit that impact radars have to the other two types, is that they bring foresight closer to taking action. With an impact radar, different parts of the organization can evaluate whether they have taken the necessary steps to prepare.
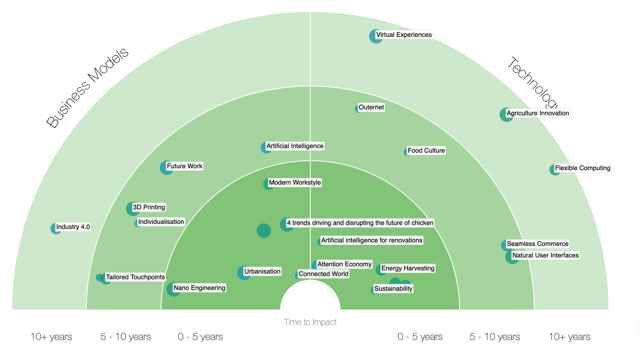
Here is a simple impact radar built with FIBRES with two sectors for Business Models and Technology:
Combination radars
While we're at it, let's coin a fourth radar type: the combination radar!
If you're visualizing your radar with pen and paper (codename for Powerpoint), your radar will be static. Once you name your sectors and place your trends somewhere on the radar, that's what it will look like.
However, it's possible to build dynamic radars that can be rearranged into different forms with the click of a button. (We'll get to the tools part later to explain how exactly.)
If you open the live version of the DHL radar, you'll notice that in addition to the two domains of Social & Business Trends and Technology Trends, you can filter trends on the radar according to topics: Auto-Mobility, Engineering & Manufacturing, Technology, Energy, Life Sciences & Healthcare, and Retail & Fashion.
In a way, the DHL radar combines a domain radar and a topic radar. (Also you might notice that DHL calls these topics "sectors". To make things somewhat more confusing, the terminology indeed is still evolving in our field.)
Two ways to work towards a trend radar
Now that you're familiar with different trend radar layouts, you might be wondering: How do I actually compile a trend radar? How do I select which trends to place on my radar?
Structure and layout aside, it is the contents of a trend radar that require the most work. The question is, in fact, much wider than compiling of a single radar: How do I continuously keep track of what is going on in my operating environment? In essence, we are talking about organizing for foresight.
The trends that are visible on your trend radar are like the tip of an iceberg. They only reflect a fraction of the data that is gathered for the purpose. A trend radar can be built without a systematic foresight process behind it, too, but the result risks being shallow and not very useful.
We would distinguish between two alternative ways of working: the top-down model that starts from already identified trends, and the bottom-up model that starts from collecting weak signals and aims to identify emerging trends.
Top-down: Starting from known trends
The top-down way of building a trend radar starts from known trends or megatrends.
You might already have identifed a few trends in your business environment. Start by placing these on your trend radar. Especially if you're building your first radar, this might be an easy way to get started.
Write a summary of the trends and their possible impacts on your business.
Share your work with others and ask for their feedback. Do they agree with your assessments? Which other trends do they think would be relevant for your business?
Based on the feedback you get, refine your trend descriptions and make additions to your radar.
Bottom-up: Starting from weak signals
The bottom-up way of building a trend radar starts from collecting weak signals. This way of working may be favored by companies and organizations with somewhat more experience in foresight work - and by the ones who deem it necessary for their strategy to always stay ahead of the game, to be among the first-movers as new phenomena start emerging.
In organizations with an existing culture of foresight work, trend radars are not worked on as standalone projects, but they are one of the results of the work they are doing already, hence the term "summary view".
The steps shared below are written from this point of view.
How to build your trend radar in 7 steps:
1. Decide the purpose of your radar
Before rushing to gather content for your trend radar, there are a few questions that you should ask yourself and perhaps other stakeholders at your company.
The first question to ask yourself is what purpose will your radar be for. Is it meant to influence strategy, technological choices, innovation, risk management, or something else? This is a fundamental question to answer in order to set a valuable structuring for your radar.
2. Think about the layout and structure
The main difference between the three different radar structures is the viewpoint that you're taking. Knowing what purpose your radar is for will help you make the call.
For example, if you're looking to construct a trend radar to inform strategic decisions, it might be beneficial to take a birds-eye view with a domain radar, like PESTEL, so that you don't limit your viewpoints too early.
3. Ask people to look for inputs
You regularly see interesting articles and reports, but you might be unsure what these mean to your business as a whole.
Every company sits on an incomparable data source – their own employees. We would always recommend including your own crew as a key source. Involving more people in foresight work is a great way to get a larger number and variety of inputs. Legitimacy of your foresight work will improve as a side product, too.
You could encourage employees to share, for example, interesting articles, social media threads, scientific articles, or just their own observations and points of view.
4. Collect inputs in one place
Having a place to save new inputs will help you collect them. The problem with feed-like channels, like discussion channels and email, is that inputs get lost under newer insights and information doesn't accumulate. In fact, using a shared repository is one of the things that increases happiness in foresight work.
In combination to employee-sourced inputs and automation, commercial sources can be a good value add for your foresight work. Consider including commercial trend data on your radar as such, or using it as an inspiration for internally derived insights.
5. Cluster signals and make sense of your data
Once these news articles, employee observations, and other pieces of content start accumulating, cluster them to make sense of them.
If you have access to a purpose-built foresight tool, you can create linkages between individual inputs and cluster them visually. If not, you could use a workaround like a spreadsheet to cluster related content.
Write trend descriptions and impact assessments for the meaningful developments.
If you're not doing the work alone, it's important to have someone in charge to make sure you go from mere inputs to insights.
6. Position your first trends on the radar
Place first items on your radar. If you are building your first radar by yourself or with a smaller group of people, but wish to include more people down the road, it might be a good idea not to make your radar too finished.
One of our customers made their initial work at great detail and with lots of content - only to realize that after introducing the radar to a wider in-house audience, little engagement and participation occurred. The setup at start simply seemed "ready-made", even if the intention was only then to start collaborating throughout a larger group of contributors.
Oddly enough, the responsible managers ended up removing parts of the already introduced content from their radar to make it look less finished. Supported by a well-organized ramp-up, a lot more people were then encouraged to share their findings, and their process is today highly collaborative.
7. Share your trend radar to make an impact
Share your findings with others. Ask for feedback and additions. Make sure that the right people in your organization have access to the radar so that the gathered information actually makes an impact.
8. Update your radar frequently
Keep on collecting inputs and making sense of them. Bring new findings to the radar.
We would recommend naming domain or topic based roles and responsibilities. If, for example, your company opted for a topic radar divided into three sectors, the work on each of such sectors could be led by a dedicated person.
These people would then be in charge of the main sense-making efforts: making sure new inputs are being monitored and analyzed, outlining trend descriptions and their updates, facilitating the work over impact assessments specific to your business, putting stuff onto your radar, and making sure the new insights are being used where they are supposed to be used.
Tools for building your trend radar
Basically, the choice boils down to two options: using a workaround, such as presentation software, or a purpose-built foresight tool.
Presentation software, like Powerpoint, are handy for visualizing simple trend radars that don't have a lot of data behind them and don't need to be updated frequently. The main benefit of such tools is their low cost, as well as wide access to them.
Problems arise when trying to move towards a more rigorous, continuous, and collaborative way of working. Where to save the inputs that influence the trends on your radar? Where to write trend descriptions and assess impacts? How to make sure new findings are updated on the trend radar?
Nonetheless, sometimes an MVP is all you need. That's why we created 3 simple trend radar templates for you to download and use freely. They're great for understanding what radars are all about, for building your first radars, and for visualizing trends for one-off purposes.
The second option is using a purpose-built radar builder. Paid tools, like FIBRES, require some investment but easily solve many of the aforementioned challenges typical in foresight work. They are also customizable and can be made to fit your foresight needs.
Use FIBRES to build your radar
If you want to build a world-class radar, FIBRES is one of your options.
1. Save your trends into FIBRES
Start building your radar by adding content. Create your content yourself or tap into our partners' databases to access ready-written trends and megatrends that can be easily placed on your trend radar.
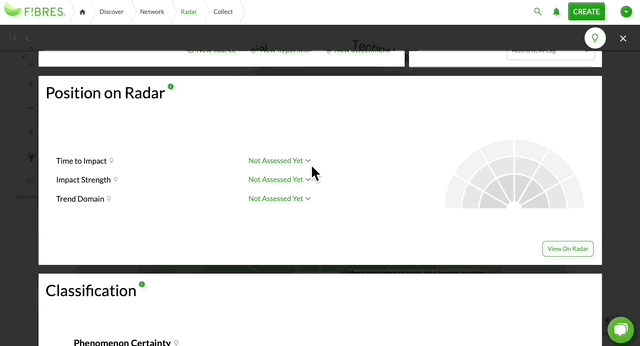
2. Position your trends on the radar
Once you have some trends in FIBRES, adding them to the radar is easy-peasy. No copy-pasting new bubbles and moving old bubbles around to fit new ones like working with a Powerpoint – just select values from a simple drop-down, and FIBRES will take care of the rest.
2. Enjoy an always up-to-date radar
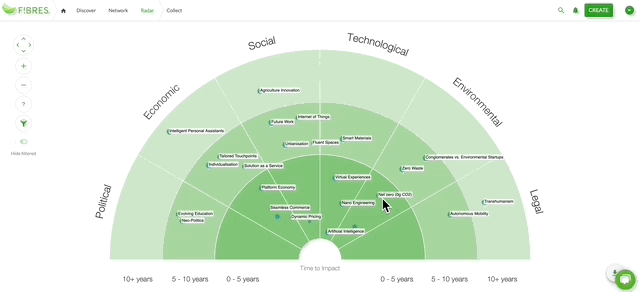
The beauty of purpose-built foresight software is that every change you make is automatically reflected on your radar. Oh, and did we mention that the FIBRES radar is customizable to your needs? This one is a PESTEL radar, but yours could like like anything else.
Explore our Foresight radars guide
This article is part of our Foresight radars guide, designed to help you strengthen foresight capabilities and advance your organization’s foresight maturity. Gain insights from practitioners, find practical answers, and share knowledge with your colleagues. Read online or download the PDF to take with you.